参数曲线和极坐标曲线动态绘图
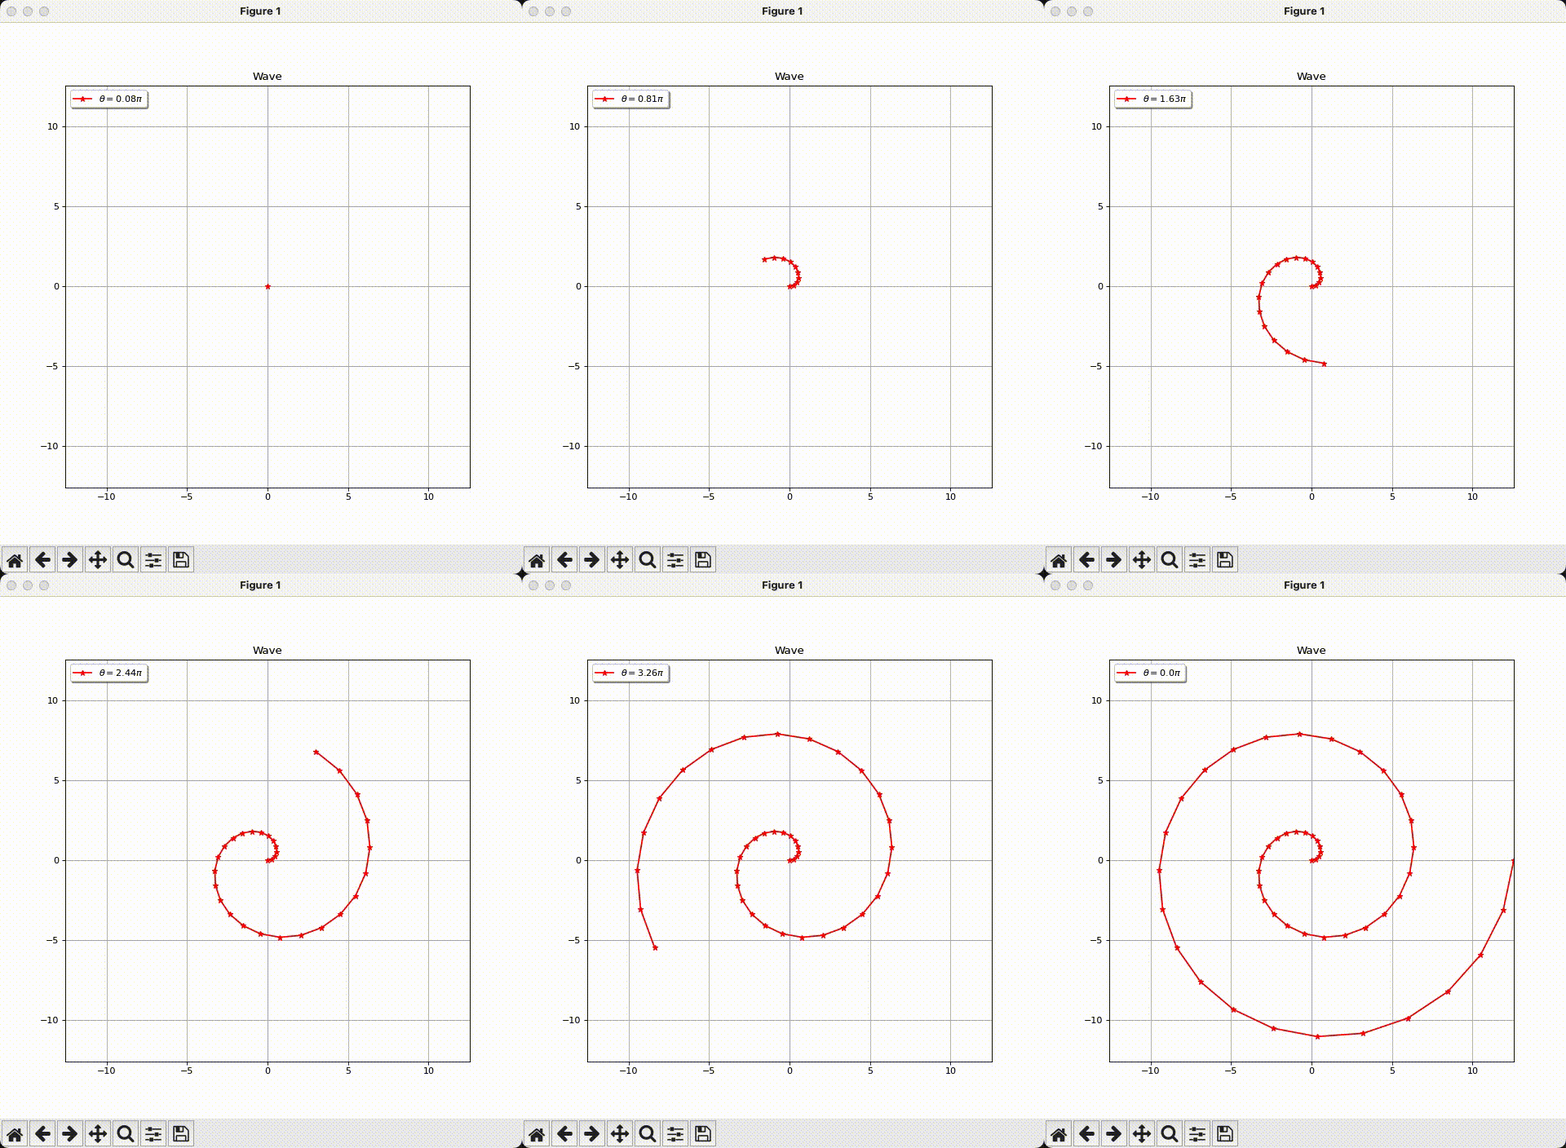
参数方程和极坐标方程曲线的动态绘制程序, python 实现.

参数方程曲线
"""参数方程函数画图
    x=ϕ(θ)
    y=ψ(θ)
"""

import numpy as np
from numpy import cos, sqrt, pi
import matplotlib.pyplot as plt

#* 椭圆
def ellipse(t):
    a=2.0
    b=1.0
    return  a*np.cos(t), b*np.sin(t)

#* 摆线
def cycloid_curve(t):
    a=2.0
    return  a*(t-np.sin(t)), a*(1-np.cos(t))

def plot_polar_coords_function(func, t_start, t_end):
    t = np.linspace(t_start, t_end, 50)
    t = np.hstack((t,t[:1]))
    x,y = func(t)
    yMax = np.max(y)
    xMax = np.max(x)

    plt.figure(figsize=(8, 4), dpi=80)
    plt.ion()

    for i in range(t.shape[0]):
        plt.cla()
        plt.title("")
        plt.grid(True)

        plt.plot(x[:i],y[:i], '*-r', label="$\\theta=$"+str(int(100*t[i]/np.pi)/100)+'$\pi$')

        plt.xlim(-xMax, xMax)
        plt.ylim(-yMax, yMax)
        plt.legend(loc="upper left", shadow=True)
        plt.pause(.15)

    plt.ioff()
    plt.show()

if __name__ == "__main__":


    # * 椭圆 (0, 2*np.pi)
    # plot_polar_coords_function(ellipse, t_start=0.0, t_end=2*np.pi)

    # * 摆线 (0, 2*np.pi)
    plot_polar_coords_function(cycloid_curve, t_start=0.0, t_end=4*np.pi)
极坐标曲线
"""极坐标函数画图
    ρ=ϕ(θ)
"""

import numpy as np
from numpy import cos, sqrt, pi
import matplotlib.pyplot as plt

#* 心形线
def heart_line(t):
    a=1.0
    return  a * (1+np.cos(t))

#* 双纽线
def lemniscate(t):
    a=1.0
    return  a * sqrt(np.abs(cos(2*t)))

#* 螺旋线
def helical_line(t):
    a=1.0
    return  a * t


def plot_polar_coords_function(func, t_start, t_end):
    t = np.linspace(t_start, t_end, 50)
    t = np.hstack((t,t[:1]))
    rho = func(t)
    Max = np.max(rho)

    plt.figure(figsize=(8, 8), dpi=80)
    plt.ion()

    for i in range(t.shape[0]):
        plt.cla()
        plt.title("")
        plt.grid(True)

        plt.plot(rho[:i]*np.cos(t[:i]),rho[:i]*np.sin(t[:i]), '*-r', label="$\\theta=$"+str(int(100*t[i]/np.pi)/100)+'$\pi$')

        plt.xlim(-Max, Max)
        plt.ylim(-Max, Max)
        plt.legend(loc="upper left", shadow=True)
        plt.pause(.15)

    plt.ioff()
    plt.show()

if __name__ == "__main__":

    # * 双纽线画图 (-np.pi/4, np.pi/4)
    # plot_polar_coords_function(lemniscate, t_start=-np.pi/4, t_end=np.pi/4)
    # * 双纽线画图 (-np.pi/4, np.pi/4)
    # plot_polar_coords_function(lemniscate, t_start=3*np.pi/4, t_end=5*np.pi/4)


    # * 螺旋线 (0, 2*np.pi)
    # plot_polar_coords_function(helical_line, t_start=0.0, t_end=4*np.pi)

    # * 心形线 (0, 2*np.pi)
    plot_polar_coords_function(heart_line, t_start=0.0, t_end=2*np.pi)
